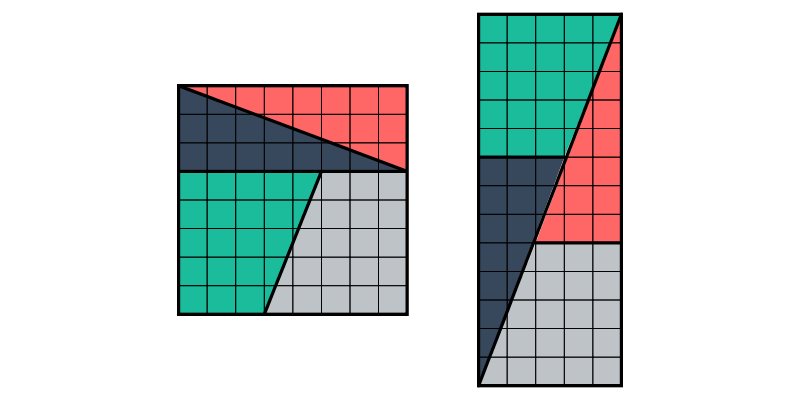
A favorite puzzle/paradox of Lewis Carroll based on Fibonacci numbers. The two figures are “obviously” composed of the same pieces, yet they have different areas!
> import Diagrams.Backend.SVG.CmdLine> {-# LANGUAGE NoMonomorphismRestriction #-}
> import Diagrams.Prelude hiding (tri)
> import Data.Colour.SRGB (sRGB24read)The standard infinite list of Fibonacci numbers.
> fibs :: [Int]
> fibs = 0 : 1 : zipWith (+) fibs (tail fibs)
Create a grid by gluing together a bunch of squares.
> grid :: Int -> Int -> Diagram B
> grid x y = frame <> lattice
>   where s       = unitSquare # lw thin
>         frame   = rect (fromIntegral x) (fromIntegral y)
>                 # lw thick
>         lattice = centerXY . vcat . map hcat . replicate y . replicate x $ s
The trapezoid and triangle shapes, with sides lengths based on two Fibonacci numbers.
> trap, tri :: Double -> Double -> Diagram B
> trap s1 s2 = lw none . strokeLoop . closeLine
>            . fromOffsets . map r2 $ [(0,-s2), (s2,0), (0,s1)]
> tri s1 s2  = lw none .  strokeLoop . closeLine
>            . fromOffsets . map r2 $ [(s1,0), (0,s1+s2)]
Draw the paradox diagram based on the nth Fibonacci number.
> paradox :: Int -> Bool -> Diagram B
> paradox n drawDiags = (sq # rotateBy (1/4)
>                    ||| strutX (s2 / 2)
>                    ||| rect # rotateBy (1/4)) # centerXY
>   where f1 = fibs !! n
>         f2 = fibs !! (n+1)
>         s1 = fromIntegral f1
>         s2 = fromIntegral f2
>
>         trap1 = trap s1 s2 # fc (sRGB24read "#BEC3C7")
>         trap2 = trap s1 s2 # fc (sRGB24read "#1ABC9C")
>                            # rotateBy (1/2)
>
>         tri1  = tri s1 s2  # fc (sRGB24read "#FF6666")
>         tri2  = tri s1 s2  # fc (sRGB24read "#37485D")
The four shapes assembled into a square.
>         sq = (if drawDiags then sqDiags else mempty)
>              <> grid (f1+f2) (f1+f2)
>              <> sqShapes
>         sqDiags = (fromVertices [p2 (0,s2), p2 (s2,s1)] <>
>                    fromVertices [p2 (s2,0), p2 (s2,s1+s2)] <>
>                    fromVertices [p2 (s2,0), p2 (s1+s2,s1+s2)])
>                 # strokeP
>                 # lw thick
>                 # centerXY
>
>         sqShapes = (traps # centerY ||| tris # centerY)
>                  # centerXY
>         traps = trap2 # alignL
>                       # translateY (s1 - s2)
>              <> trap1
>         tris  = tri1 # alignBL
>              <> tri2 # rotateBy (1/2)
>                      # alignBL
The four shapes assembled into a rectangle.
>         rect = (if drawDiags then rDiags else mempty)
>                <> grid (2*f2 + f1) f2
>                <> rShapes
>
>         rShapes = (bot # alignTL <> top # alignTL) # centerXY
>         bot = trap1 # alignB ||| rotateBy (-1/4) tri1 # alignB
>         top = rotateBy (1/4) tri2 # alignT ||| trap2 # alignT
>
>         rDiags = (fromVertices [p2 (0,s2), p2 (2*s2+s1, 0)] <>
>                   fromVertices [p2 (s2,0), p2 (s2,s1)] <>
>                   fromVertices [p2 (s1+s2,s2-s1), p2 (s1+s2,s2)]
>                   )
>                  # strokeP
>                  # lw thick
>                  # lineCap LineCapRound
>                  # centerXY
Draw the order-4 diagram with thick lines in the middle. Passing the argument False causes the thick lines to be omitted, revealing the skinny gap in the rectangular assembly. Lower-order diagrams make the gap more obvious; higher-order diagrams make it increasingly less obvious (but make the grid smaller).
> example = paradox 4 True # frame 0.5> main = mainWith (example :: Diagram B)