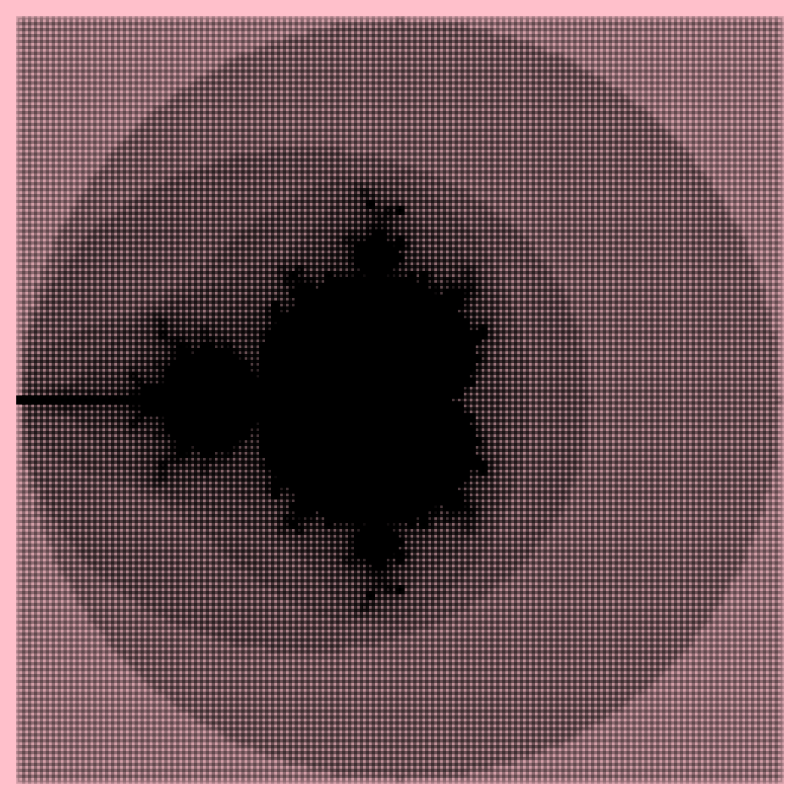
A discretized version of the familiar Mandelbrot set. Adapted from code written by MathematicalOrchid.
> import Diagrams.Backend.SVG.CmdLine> {-# LANGUAGE NoMonomorphismRestriction #-}
> -- Addapted from: "The MathematicalOrchid, 24 Feb 2007"
> -- http://warp.povusers.org/MandScripts/haskell.html
>
> import Data.Complex
> import Diagrams.Prelude hiding (magnitude,image)Code to compute orbits of complex numbers under the Mandelbrot transformation, and decide on the magnitude of a pixel based on how slowly its orbit diverges.
> quadratic c z = z*z + c
>
> critical_orbit :: Complex Double -> [Complex Double]
> critical_orbit z = iterate (quadratic z) 0
>
> pixel = length . takeWhile (\z -> magnitude z <= 2) . take maxIter
> maxIter = 32
> edge = 128
Generate a grid of points of the desired size.
> side n v0 v1 =
>    let sv = (v1 - v0) / fromIntegral n
>    in  [v0, (v0 + sv) .. v1]
>
> sideX = side edge (-2) 2
> sideY = side edge (-2) 2
>
> grid = map (\y -> map (:+ y) sideX) sideY
Generate the Mandelbrot image as a grid of pixel magnitudes.
> image = map (map (toSquare . pixel . critical_orbit)) gridTo lay out the pixels in a grid we have to make them into a square whose opacity varies with the square root of the pixel value.
> toSquare n = square 1 # lw medium # fc black # opacity (sqrt o)
>   where o = fromIntegral n / maxIter
>
> example = (vcat . map hcat $ image) # bgFrame 3 pink
> main = mainWith (example :: Diagram B)