by Brent Yorgey on April 25, 2015
Tagged as: release, features, announcement, 1.3.
Diagrams 1.3
The diagrams team is very pleased to announce the release of diagrams 1.3. The actual release to Hackage happened a week or so ago, and by now I think we have most of the little kinks ironed out. This is an exciting release that represents a great deal of effort from a lot of people (see the list of contributors at the end of this post). Here's a quick rundown of some of the new features. If you're just looking for help porting your diagrams code to work with 1.3, see the migration guide.
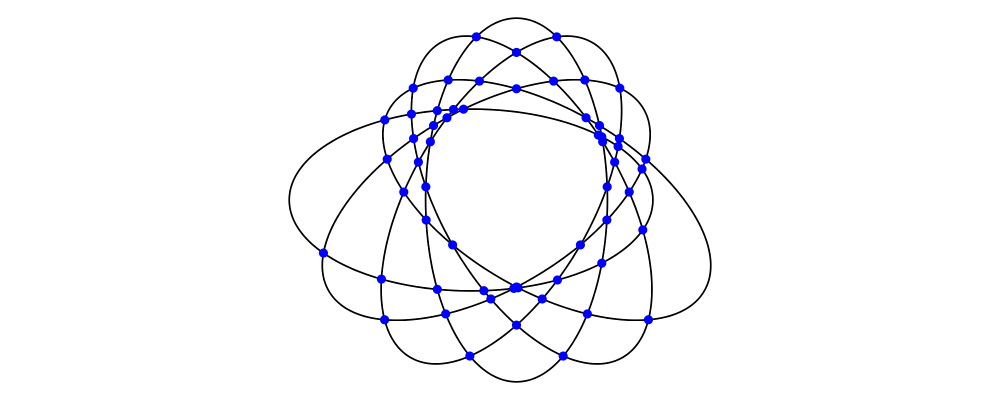
Path intersection
Using the functions intersectPointsP and intersectPointsT, it is
now possible to find the points of intersection between two paths or
two trails, respectively. This is not so hard for paths with straight
segments, but for cubic Bezier curves, finding intersection points is
nontrivial!
> {-# LANGUAGE TupleSections #-}
>
> example :: Diagram B
> example = mconcat (map (place pt) points) <> mconcat ellipses
>   where
>     ell = circle 1 # scaleX 2
>     pt  = circle 0.05 # fc blue # lw none
>     ellipses = [ ell # rotateBy r # translateX (2*r) | r <- [0, 1/12 .. 5/12] ]
>     points = allPairs ellipses >>= uncurry (intersectPointsP' 1e-8)
>     allPairs [] = []
>     allPairs (x:xs) = map (x,) xs ++ allPairs xs
Note that this feature is something of a "technology preview" in diagrams 1.3: the API will probably change and grow in the next release (for example, giving a way to find the parameters of intersection points).
Affine maps and projections
Affine maps have been added to Diagrams.LinearMap that can map
between different vector spaces. The Deformable class has
also been generalised to map between spaces. Helper functions have
been added to Diagrams.ThreeD.Projection for basic orthographic
and perspective projections.
In the below example, we construct a 3-dimensional path representing the wireframe of a simple house, and then project it into 2 dimensions using perspective, orthographic, and isometric projections.

> import Diagrams.ThreeD.Transform  (translateZ)
> import Diagrams.ThreeD.Projection
> import Diagrams.LinearMap         (amap)
> import Linear.Matrix              ((!*!))
>
> box :: Path V3 Double
> box = Path [f p1 ~~ f p2 | p1 <- ps, p2 <- ps, quadrance (p1 .-. p2) == 4]
>   where
>     ps = getAllCorners $ fromCorners (-1) 1
>     f  = fmap fromIntegral
>
> roof :: Path V3 Double
> roof = Path
>   [ mkP3 1 1 1       ~~ mkP3 1 0 1.4
>   , mkP3 1 (-1) 1    ~~ mkP3 1 0 1.4
>   , mkP3 1 0 1.4     ~~ mkP3 (-1) 0 1.4
>   , mkP3 (-1) 1 1    ~~ mkP3 (-1) 0 1.4
>   , mkP3 (-1) (-1) 1 ~~ mkP3 (-1) 0 1.4
>   ]
>
> door :: Path V3 Double
> door = fromVertices
>   [ mkP3 1 (-0.2) (-1)
>   , mkP3 1 (-0.2) (-0.4)
>   , mkP3 1 (0.2) (-0.4)
>   , mkP3 1 (0.2) (-1)
>   ]
>
> house = door <> roof <> box
>
> -- Perspective projection
> -- these bits are from Linear.Projection
> m  = lookAt (V3 3.4 4 2.2) zero unitZ
> pm = perspective (pi/3) 0.8 1 3 !*! m
>
> pd = m44Deformation pm
> perspectiveHouse = stroke $ deform pd (translateZ (-1) house)
>
> -- Orthogonal projection
> am = lookingAt (mkP3 3.4 4 2.2) zero zDir
> orthogonalHouse = stroke $ amap am house
>
> -- Isometric projection (specialised orthogonal)
> isometricHouse = stroke $ isometricApply zDir house
>
> example :: Diagram B
> example = hsep 1 . map (sized (mkHeight 3) . centerXY) $
>   [ perspectiveHouse, orthogonalHouse, isometricHouse ]
Note that this should also be considered a "technology preview". Future releases of diagrams will likely include higher-level ways to do projections.
Grouping for opacity
A few backends (diagrams-svg, diagrams-pgf, and
diagrams-rasterific as of version 1.3.1) support grouped
transparency. The idea is that transparency can be applied to a
group of diagrams as a whole rather than to individual diagrams. The
difference is in what happens when diagrams overlap: if they are
individually transparent, the overlapping section will be darker, as
if two pieces of colored cellophane were overlapped. If transparency
is applied to a group instead, the transparency is uniformly applied
to the rendered output of the group of diagrams, as if a single piece
of colored cellophane were cut out in the shape of the group of
diagrams.
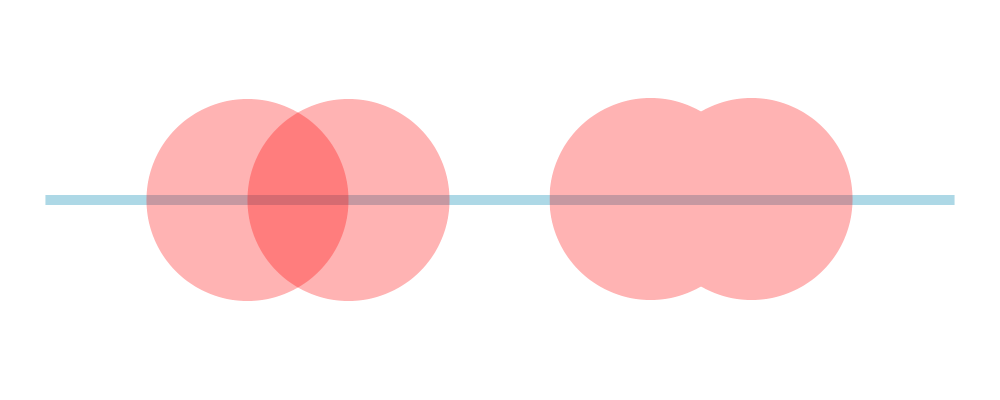
An example should help make this clear. In the example to the left
below, the section where the two transparent circles overlap is
darker. On the right, the call to groupOpacity means that the
entire shape formed form the union of the two circles is given a
uniform opacity; there is no darker region where the circles overlap.
> cir = circle 1 # lw none # fc red
> overlap = (cir <> cir # translateX 1)
>
> example = hsep 1 [ overlap # opacity 0.3, overlap # opacityGroup 0.3 ]
> # centerX
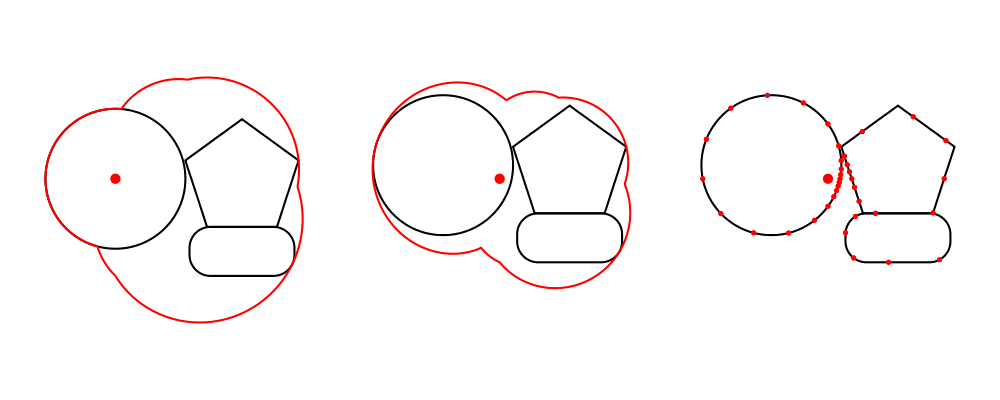
> <> rect 9 0.1 # fc lightblue # lw noneVisualizing envelopes and traces
Some new functions have been added to help visualize (approximations of) the envelope and trace of a diagram. For example:
> d1, d2 :: Diagram B
> d1 = circle 1
> d2 = (pentagon 1 === roundedRect 1.5 0.7 0.3)
>
> example = hsep 1
>   [ (d1 ||| d2)          # showEnvelope' (with & ePoints .~ 360) # showOrigin
>   , (d1 ||| d2) # center # showEnvelope' (with & ePoints .~ 360) # showOrigin
>   , (d1 ||| d2) # center # showTrace' (with & tPoints .~ 20) # showOrigin
>   ]
Better command-line looping
For some time, many diagrams backends have had a "looped compilation
mode", where the diagram-rendering executables produced take a
--loop option, causing them to watch for changes to a source file,
recompile and relaunch themselves. Support for this feature is now
greatly improved. We have switched to use fsnotify, which
eliminates polling and allows the feature to work on Windows for the
first time (previous versions depended on the unix package).
The output of the --loop mode has also been improved.
New backends
The diagrams-postscript, diagrams-svg,
diagrams-cairo, diagrams-gtk, and
diagrams-rasterific backends are all still going strong and
fully supported. We now have several new backends as well:
diagrams-html5 generates Javascript which sets up an HTML5
canvas containing the diagram; diagrams-canvas also targets
HTML5 canvas, but uses the blank-canvas package to interact
directly with an HTML5 canvas, enabling various sorts of
interactivity. We also have a new backend diagrams-pgf which
generates PGF/TikZ code suitable for including in \(\TeX\)
documents—one can even have embedded text in diagrams typeset by
\(\TeX\), allowing e.g. mathematical formulas as labels for
things in your diagram.
Generalized numerics
It used to be that diagrams were hard-coded to use Double. As of
version 1.3, Double is no longer baked in: diagrams are now
parameterized by a suitable numeric type. It's too early to tell what
the full implications of this will be, but in theory it opens up
opportunities for things like automatic differentiation, constraint
solving, and using diagrams in conjunction with deeply embedded DSLs.
This feature in particular was a tough nut to crack and is the fruit
of a lot of labor. I want to especially highlight the work of Jan
Bracker, Allan Gardner, and Frank Staals, all of whom did a lot of
work attempting to generalize diagrams in this way. Although their
code ultimately did not get merged, we learned a lot from their
attempts! The fourth attempt, by Chris Chalmers, actually stuck. A
big factor in his success was to simultaneously replace the
vector-space package with linear, which turns out to
work very nicely with diagrams and with generalized numeric types in
particular.
Note that this is a Very Breaking Change as the types of almost
everything changed. Anything which used to take a single type
representing a vector space (such as R2) as an argument now takes
two arguments, one for the structure/dimension of the vector space
(e.g. V2) and one for the numeric/scalar type. See the migration
guide for more specific information and help upgrading!
And lots more...
Of course, there are lots of other miscellaneous improvements, added type class instances, new lenses and prisms, bug fixes, and the like. For a full rundown see the release notes. There is also lots more exciting stuff in the pipeline!
Contributors
We now have a team of 5 people working very actively on diagrams (Chris Chalmers, Daniel Bergey, Jeff Rosenbluth, Ryan Yates, and myself), with many, many more contributing here and there. As a way to say thank you for all the great contributions and hard work by many in the community, below is a (probably incomplete) list of people who have contributed to diagrams in some way — all 67 of them! We welcome involvement from anyone, regardless of experience. If you'd like to get involved, come chat with us on the #diagrams IRC channel on freenode, or send a message to the mailing list.
Diagrams contributors:
Alexis Praga / Allan Gardner / Andy Gill / Anthony Cowley / Bartosz Nitka / Ben Gamari / Brent Yorgey / Carlos Scheidegger / Carter Tazio Schonwald / Chris Mears / Christopher Chalmers / Claude Heiland-Allen / Conal Elliott / Daniel Bergey / Daniel Kröni / Daniel Wagner / Daniil Frumin / Deepak Jois / Denys Duchier / Dominic Steinitz / Doug Beardsley / Felipe Lessa / Florent Becker / Gabor Greif / Hans Höglund / Heinrich Apfelmus / Ian Ross / Jan Bracker / Jeffrey Rosenbluth / Jeremy Gibbons / Jeroen Bransen / Jim Snavely / Joachim Breitner / Joel Burget / John Lato / John Tromp / Jonas Haag / Kanchalai Suveepattananont / Kaspar Emanuel / Konrad Madej / Konstantin Zudov / Luite Stegeman / Michael Sloan / Michael Thompson / Moiman / Niklas Haas / Peter Hall / Pontus Granström / Robbie Gleichman / Robert Vollmert / Ryan Scott / Ryan Yates / Sam Griffin / Scott Walck / Sergei Trofimovich / sleepyMonad / soapie / Steve Sprang / Steven Smith / Tad Doxsee / Taneb / Taru Karttunen / Tillmann Vogt / Tim Docker / Vilhelm Sjöberg / Vincent Berthoux / Yiding Jia